Benchmark your people.
Strengthen your business.
Know where you stand. See where to invest. Connect pay, leadership, and retention to the performance of your organization.
The numbers. The gaps. The next move.
Example figures show the report format. Market data is not connected yet.
People & performance
Retention · hiring · development
Example organization
Manufacturing · 50–249 employees peer group
Annual turnover
18%
Peer median 14%
Time to hire
42 days
Peer median 35 days
Learning / employee
$850
Peer median $1,100
Retention across your teams
Employees retained (%)
Operations has the largest retention gap
Review manager support, workload, and growth opportunities before expanding the team.
From competitive pay to profitable teams.
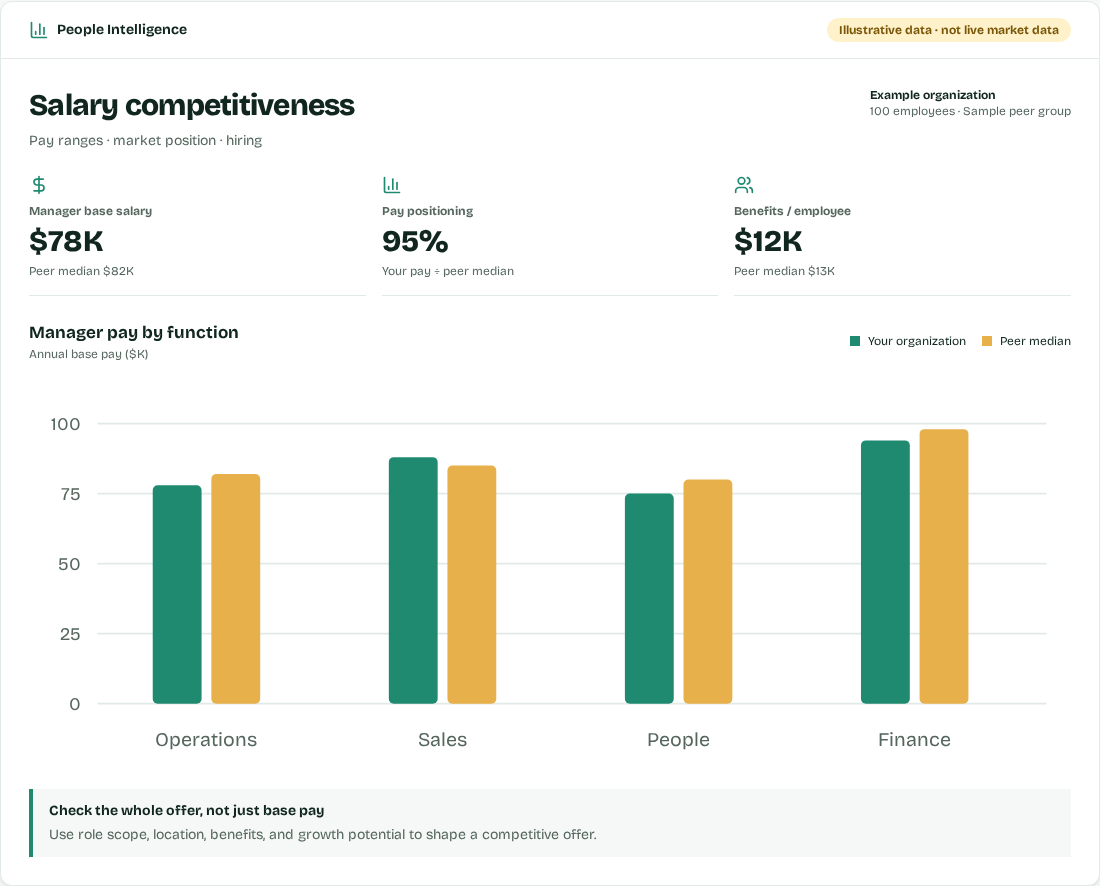
Salary & benefits
See how your offer compares across leadership functions.
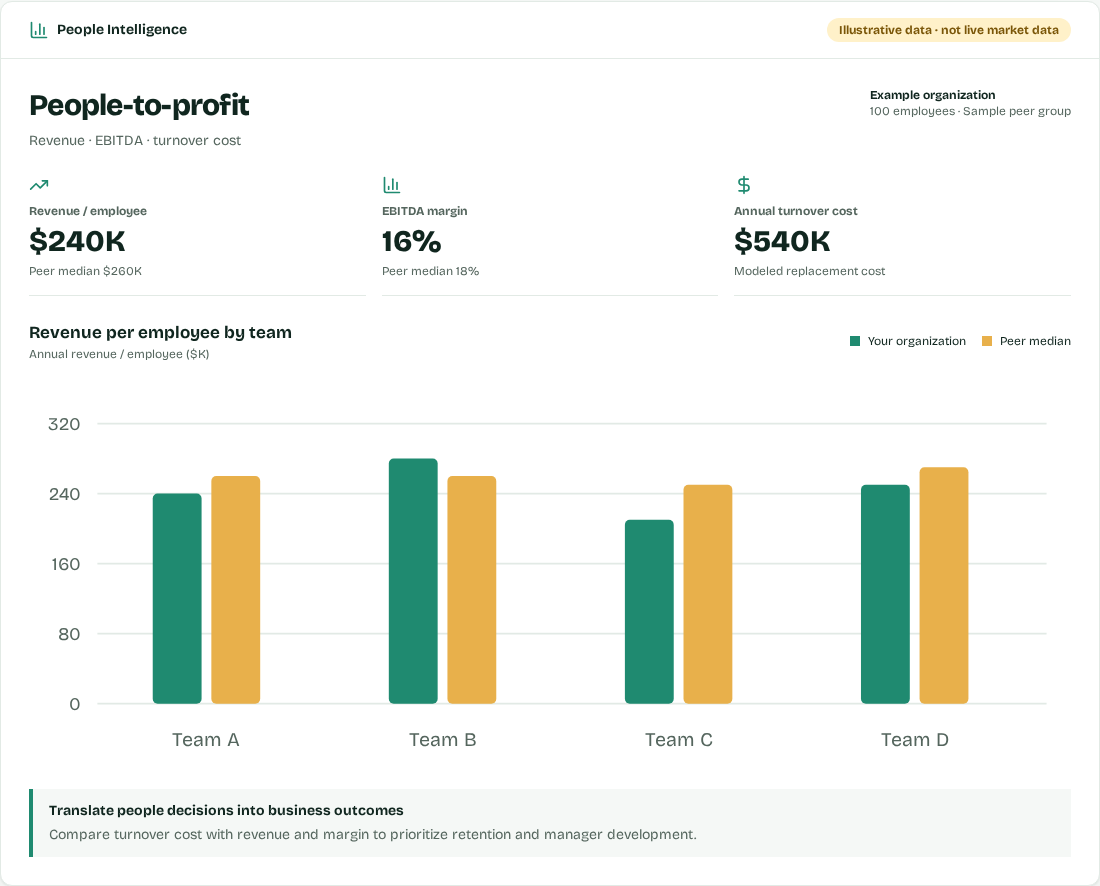
People-to-profit
Connect revenue, EBITDA, and the cost of losing experience.
Screenshots of the illustrative preview above—not a live report or connected market dataset.
Turn comparison into better leadership.
Compete for the right people
Compare salary and benefits for similar roles. Shape offers that reflect the market and the value of the work.
Develop leaders where it counts
Look at turnover, engagement, and learning together. Use gaps to focus manager coaching and career development.
Connect people to profit
Track revenue per employee, people cost, and EBITDA margin. Weigh investment in your team against business results.
Choose what matters.
Compare like with like.
A meaningful comparison starts with similar organizations—not a one-size-fits-all average. Select your metrics, industry, company size, and location in the benchmark builder.
Choose my metrics01 / Set the context
Match the peer group to your industry, size, and location.
02 / Find the gaps
Compare salaries, retention, benefits, and profitability side by side.
03 / Make a focused investment
Prioritize one opportunity, set a target, and revisit your inputs monthly.
A clearer line from people to performance.
Revenue / employee
Revenue ÷ average headcount
Understand output alongside growth, workload, and team structure.
EBITDA margin
EBITDA ÷ revenue × 100
Put operating profitability in context with comparable businesses.
People cost ratio
Total people cost ÷ revenue × 100
Balance pay, benefits, and development against sustainable revenue.
Turnover cost
Exits × replacement cost
Model the financial impact of losing people and retaining experience.
Compare similar business models and consistent reporting periods. Benchmarks guide decisions; they do not prove that any single people investment caused a change in profit.